09:00 AM
Can Your IT Group Beat the Market Benchmark?
Financial markets rely on benchmarks -- the Dow Jones, S&P, NASDAQ, and more. National economies rely on them too -- the Consumer Price Index, the Consumer Confidence Index, GDP/GNP, and many others.
Today, most agree we are in a "Technology Economy," where technology is not only driving change, but also economic growth. In such an economy, technology leaders need similar highly transparent benchmarks to calibrate and gauge the position of their company's IT resources, their performance trajectories, and their competitiveness. This is particularly critical in the world of financial services, where a major component of cost and operating efficiency is driven by technology and the ability of an IT organization to provide commodity services at or below market rates.
Fortunately, the increased focus on IT efficiency and effectiveness that we have seen during the past five years as IT demand and cost pressure has risen have provided technologists with accurate and transparent data to create appropriate benchmarks. IT infrastructure is perhaps the proverbial "poster child' for the availability of such data.
Benchmark: Infrastructure Cost Index (ICI)
The basis of the Infrastructure Cost Index (ICI) is a "market basket" of technology platforms that parallels the concepts underlying the consumer price index. For starters, consider an IT infrastructure market basket using 2009 as the base year consisting of 100,000 installed MIPS, 10,000 UNIX servers, 20,000 Wintel servers, 25 PB of SAN/NAS storage, 150,000 end user devices (desktops/laptops), a service desk supporting an annual call volume of 300,000, and a data network with 600,000 ports.
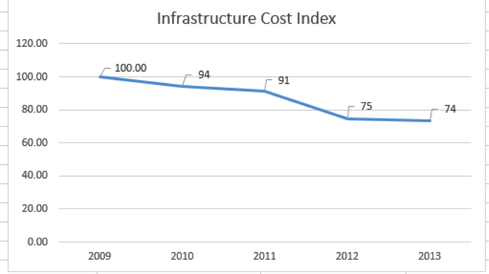
Now if you multiply each of these volumes by the 2009 fully loaded unit cost for each market basket component (drawn from a global database of over 2,000 companies) and then sum up all the volume unit cost computations, the result is a total market basket cost of $1.415 billion. If you then take the same volumes and multiply by the 2013 fully loaded unit costs, the resulting market basket cost is $1.043 billion. For purposes of creating the Infrastructure Cost Index, if the base year of 2009 is considered to be 100, then by 2013 the index is at 74. This indicates a 26% reduction in the cost of the market basket (with a no growth scenario) and an annual reduction in cost averaging 6.5%

In essence this means that the 'market" is improving its economic efficiency by 6.5% a year and that is the "benchmark" rate of improvement. In the financial markets, its one of the few times you want to see a downward trend.
If you want your organization to be at "the market" that is the pace you need to maintain. If you have an outsourcing agreement supporting your organization for infrastructure services, unless your deal moves at the rate of the market you will likely find yourself non-competitive.
NEXT PAGE: Benchmark: Infrastructure Labor Productivity Index (ILPI)
Dr. Howard A. Rubin is a Professor Emeritus of Computer Science at Hunter College of the City University of New York, a MIT CISR Research Affiliate, a Gartner Senior Advisor, and a former Nolan Norton Research Fellow. He is the founder and CEO of Rubin Worldwide. Dr. Rubin is ... View Full Bio


