09:00 AM
Can Your IT Group Beat the Market Benchmark?
Benchmark: Infrastructure Labor Productivity Index (ILPI)
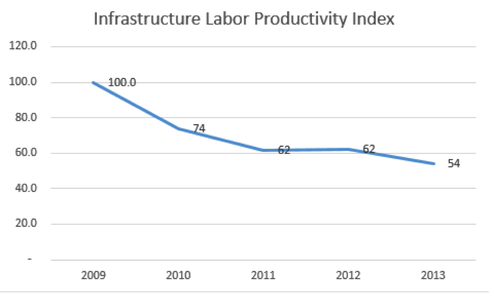
Using a the same market basket composition for the Infrastructure Labor Productivity Index (ILPI), the size the of labor pool needed to support the set of market basket services can be computed by simply dividing each of the volumes by the 2009 support productivity for each platform. Using 2009 data, it would take 3,707 full-time employees (FTE) to support the market basket. Applying 2013 support productivity data yields a 2013 FTE figure of 2,012. As many of you have experienced (and are still experiencing), the financial services industry has also reduced staff since 2009.
Using the same technique as for the ICI, if you set 2009 as the base year at 100, 2013 is at 54.

Overall the benchmark shows a greater than 11% increase in staff productivity per year, which is quite remarkable.
Benchmark: deeper dives
Underlying the indices is platform level data that can actually be used to index/benchmark economic efficiency and labor productivity for each market basket component.

Storage shows the greatest decline in cost (-16.4%) on an annual basis during the period 2009 to 2013 along with an astounding increase in support productivity (142.5%).
As you can easily imagine, it is possible to create individual indices for each of these “commodities” and thereby benchmark your organization at a more detailed level of analysis.
And, as mentioned earlier, if you are relying on outsourcing for any of these services, if your costs are not moving at these rates, you run the risk of not being competitive.
NEXT PAGE: So, What Do I Do With All Of This?
Dr. Howard A. Rubin is a Professor Emeritus of Computer Science at Hunter College of the City University of New York, a MIT CISR Research Affiliate, a Gartner Senior Advisor, and a former Nolan Norton Research Fellow. He is the founder and CEO of Rubin Worldwide. Dr. Rubin is ... View Full Bio


