05:35 PM
Tracking the True Technology Cost of Compliance, Regulation & Risk
No doubt you have heard of the Internet of Things. But have you ever heard of the Bank of Banks?
No? OK, let me explain. Suppose you combine data on the performance of Bank of America, BNY Mellon, Citi, Credit Suisse, Deutsche Bank, Goldman Sachs, JPMorgan Chase, Morgan Stanley, UBS, and Wells Fargo and create a mega-bank composite of all of them. This is what we will call the Bank of Banks. This mix captures the nuances of a very broad spectrum of financial services businesses, geographies, regulatory forces, and, of course, business (and technology) strategies.
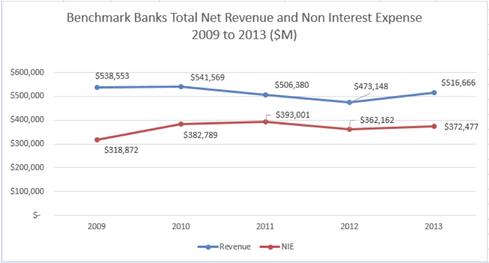
If you look at composite business performance over time, you will find that the fictitious Bank of Banks generated more than $538 billion of net revenue (NR) in 2009 with non-interest expenses (NIE) of about $319 billion. This resulted in a gross margin of about 41%. Fast forward to 2013, and the numbers look a little different. The Bank of Banks would have produced about $517 billion of NR with about $372 billion of NIE, resulting in a gross margin of 28%.
As the following chart of year-by-year data illustrates, it was not a very linear journey from 2009 to 2013 in terms of business performance.

Overall for our Bank of Banks, NR declined 4.1% from 2009 to 2013, while NIE increased 16.1%. When you overlay a technology economics perspective on the aforementioned business parameters, an intriguing -- though perhaps not surprising -- pattern is evident. Total technology expenses grew 10.5% over the four-year period. For this group, this represents an absolute increase of $4.8 billion, or $1.2 billion per year. Yikes.


